Multi-view Virtual Reality interface for 3D GIS [1]
Rick Germs,, Gert van Maren, Edward Verbree, Frederik Jansen
We describe a VR interface for 3D GIS to support the design, development and presentation of large infrastructure plans. We introduce a multi-view approach where each view has a preferred VR display of and interaction mode with the data. Next to the different view modes, an essential feature of the system is the support for manipulation and editing of GIS data from within the VR environment. The multi-view approach is implemented in the Karma VI system, using existing GIS and VR technology. We describe the multi-view approach, the system components and the internal data models, and how CAD models can be imported and be made consistent with the GIS data.
1. Introduction
Virtual reality offers new and exiting opportunities to visualize 3D GIS data. Users can walk through 3D environments, see newly planned buildings and appreciate changes in the landscape. In most cases, however, interaction with the data is limited to viewing. There may be some form of navigation and interrogation, e.g. the user may walk around in the virtual environment and may point to objects in the scene and ask for information from a GIS database. However, the possibilities to interrogate the GIS database in a more intelligent way and to access more advanced GIS functionality are limited. One reason being that within an immersive environment there is no good 3D alternative for direct modeling interaction or for alphanumeric input with mouse and keyboard to formulate a GIS-query. So, next to an immersive VR environment we need other visualization modes to support interaction. After an analysis of the design and planning process of large infra-structural plans, and an analysis of the current available VR tools, we will introduce our multi-view approach.
Examination of the planning of design projects for large infra-structuresVV98 did reveal that three main design stages can be discerned each with a different use of GIS systems:
- Orientation (plan study)
- Modeling (plan development)
- Presentation (decision making)
During the orientation stage, the use of GIS-systems is confined to standard 2D functionality for creation, manipulation and analysis of geographic objects. Objects are only indicated by position and contour. Visualization is achieved through 2D plans and maps. In the modeling stage, infrastructure engineers are more concerned with the general arrangement of objects, as well as size, dimension and the relation between objects. The use of GIS-systems in this stage shifts from 2D to 3D modeling and analysis. A 3D-scale model of the construction site and its surroundings is used for both visualization and manipulation of 3D objects. Finally, during the presentation stage, the design will be converted into a form to be presented to all participants in the decision process. This can be done either through detailed drawings, artist's impressions, CAD renderings, photo-collages, or with very detailed and realistic scale models. Visual analysis is the main task at this stage of the plan process and a more realistic visualization will greatly improve the presentation of the plans.
Summarizing, during the planning and development process, the plan goes through different stages, each using a specific representation, each addressing specific ways of analyzing and visualizing the plans. We therefore decided to use a multi-view approach with a preferred virtual reality display system for each view.
The basic concept of virtual reality (VR) is the direct coupling of the virtual viewing position (used to generate the image on the display) with the real head position and viewing direction of the user. The head position of the user is constantly tracked and fed into the display system to calculate a correct stereoscopic and perspective display of the scene. This strong coupling of the current eye position and the image offered by the display system gives the user the illusion of 'immersiveness'. Current VR systems range from true immersive to non-immersive displays.
A head-mounted display (HMD) is an example of a fully immersive VR display, which effectively isolates a single user from the real environment. The CAVE (Cave Automatic Virtual Environment)CSD93 [3] is a multiple screen projective display system that offers stereoscopic surround projection to several users simultaneously. Other (single-screen) projection systems are less `immersive' than the CAVE, but a 3D impression can still be maintained. These systems are more suited for visual presentations to groups. An interesting development is the so-called Virtual WorkbenchKru95: a table with projection through the tabletop: the 3D image can be visualized on top of the table or inside the table. Users are not `immersed', but rather look from above on the displayed objects. It offers a presentation mode that is normally associated with a 3D-scale model. Finally, even personal computers can offer (non-immersive) stereoscopic display, bringing VR to the desktopEGH93Kal94.
Combining the three design stages and interaction modes with the different VR visualization techniques, we derive three modes for modeling and visualization, which we call 'views' (figure 1).
|
|
|
|
|
Plan view (a) |
Model view (b) |
World view (c) |
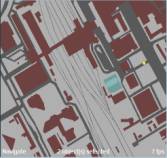
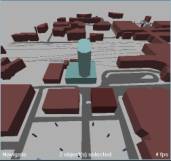
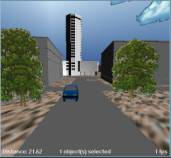
Figure 1. Different view modes visualizing a part of the centre of the city of Utrecht in the Netherlands.
The plan view visualizes the data as a conventional cartographic map. The plan view can be suitably displayed in a window on a standard monitor. The model view provides a 3D bird’s-eye view on a partly symbolic and simplified 3D representation of the data. The preferred display system is the virtual workbench. The world view gives the full immersive and photo-realistic 3D display and is best viewed within an immersive environment (CAVE). These views or modes can be used simultaneously or intermittently, on one display system or on multiple systems, and each provides a repertoire of interaction possibilities that is apt - but not necessarily limited - to that kind of visualization and interaction.
2. Multi-view approach
In this section, we elaborate the multi-view approach and describe the visualization method and preferred display system for each view. Finally, user interaction modes are discussed.
Plan View
In this view, geographic data is visualized in a conventional cartographic map format (figure 1a). Spatial objects are represented by 2D points, lines, polygons and symbols. Thematic data is visualized using standard text annotation and classification techniques. The plan view requires 2D symbolic representations that are defined in a (x, y) coordinate system, and are built up out of points, lines and polygons (areas). The model view relies on a 2-1/2 D geometric representation. The plan view, as described here, is comparable to the visualization in most of today’s GIS.
Model View
The model view offers a so-called bird’s eye view on geographic data (figure 1b) which makes it possible to visualize 2-1/2 D and 3D data. The 2-1/2 D representation is actually just a 2D data representation, where each 2D point, line or area feature is given an additional ‘height’ value (z-coordinate). Only one z can exists at any (x, y) coordinate. That is why this geometric representation is called 2-1/2 D; in a real 3D coordinate space, any combination of (x, y, z) is allowed. To model the ground level, TINs (Triangular Irregular Networks) are used. True 3D objects can be represented by elementary 2-1/2 D building blocks (e.g. for houses, buildings and other constructions).
Visualization in this view is kept simple and the user looks down on the model from the bird’s eye viewpoint, as if it is an ordinary 3D-scale model. The resemblance between the model view and an ordinary 3D-scale model is not just a coincidence. A 3D-scale model offers an overview on the area of interest, giving users the ability to make changes to the model without losing sight on the (overall) effects of these changes. Visualization in the model view is aimed at just that type of functionality: to let users `model’ their 3D geographic data.
World View
This is the immersive, first person view on the area of interest. The purpose of this view is to give a realistic impression of the changes in the landscape, using both visual and auditive output (figure 1c). The user can `walk through’ the geographic data, which are visualized using detailed 3D CAD models, enriched with texture maps and procedural models (e.g. to create vegetation, traffic and weather conditions).
For each view, there is a preferred display system. The plan view is most efficient on a monitor with window and mouse interaction. For the model view, a virtual workbench will be an appropriate display system. The world view is best viewed with a truly immersive display. A HMD can be used, but display systems with surround projection, such as the CAVE are preferred.
However, it would be very inconvenient to always have to change display system when turning to another view. Therefore, all views should be supported on all available systems. For example, it should be possible to open a window in the world view to display the plan view. Similarly, it should be possible to display the world view on a standard monitor, even if this would mean loss of stereo and sense of immersion.
The three views require different ways to navigate through, and interact with the data. The plan view is best suited for specifying, selecting and exploring data. A user will be able to navigate through scrolling, panning and zooming or through browsing via hypertext links. The user interface will accommodate most features of today's GIS systems, using standard interface components like menus en icons.
The model view lets a user arrange infrastructure objects like buildings, roads and bridges. Therefore, objects can be grouped or organized in a hierarchy or layer and manipulated using relations and constraints. These relations, constraints, layers and other hierarchical structures will have to support manipulation and interaction. View point changes and navigation can be steered by gestures (using a data glove), real head movements or by using more conventional devices like a trackball.
In the world view, attention is directed to navigation and evaluation by ‘looking at’ the infrastructure objects and their surroundings. Because of the lack of overview, manipulation of objects is not considered useful in this view. The user's main activity will be navigating through the 3D scene from a first-person viewpoint, gathering information like object attributes and distance from the viewpoint. In an immersive VR environment, input devices like a data glove or ‘magic wand’ are preferred.
GIS functionality (i.e. analyses and queries) should also be supported in all views, although each view may have a specific way of interaction to select objects and to specify the query operators. For instance, in the world view, it would be most natural to have the symbolic (alphanumeric) information specified with a spoken-language interface, while in the plan view a more conventional interaction method may give a better user support.
3. System design
At the time of this research project (ca. 1998), there did not exist a GIS system with full 3D capabilities. Most systems would ony support 2-1/2 D funcitonality. Therefore we chose to use a standard GIS-system and to model and store the full 3D representation of buildings and other spatial objects in a separate CAD-format and to link the CAD data with the GIS data. That means that the CAD data is imported in the visualization modules at the moment it is needed (e.g. in the world view). In the GIS-system a 2 1/2 D version of the CAD data is maintained. A similar 2 1/2 D representation is used in the model view for modeling interaction. Figure 2 (left) shows the components and the different views.
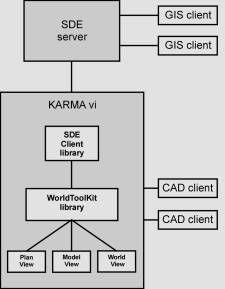
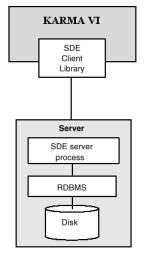
Figure 2. System components and views (left) and SDE architecture (right).
For the GIS, we have chosen for one central data server. This way, the visualisation and interaction part (called Karma VI) can act as a client on the central data server in a client / server architecture and existing GIS applications can make use of the same data. Furthermore, data consistency and integrity can be maintained better if the spatial and attribute data are stored in one central database. In addition, many users can access the same data simultaneously.
We selected the Spatial Database Engine from ESRIESRI as our GIS data server. SDE is capable of storing and retrieving spatial and attribute data in a centrally maintained database built on open relational database management system (RDBMS) standards. We use OracleORACLE as our RDBMS.
Karma VI is built as a client application on SDE and uses the SDE client library to connect to the server. On the server side are the SDE server process, the relational database management system, and the actual data. SDE uses cooperative processing, which means processing occurs on both the SDE client library and the server, depending on which is faster (Figure 2 - right).
SDE uses a continuous, non-tiled spatial model for adding spatial data to a relational database management system.
The VR-modules were implemented in the WorldToolKit (WTK) from Sense8WTK97 which is a portable, cross-platform development system for visual simulation and virtual reality applications.
CAD model data are imported from external CAD-systems. Although the 3D data is imported, it still has to comply and to be consistent with the 2D and 2-1/2D data in the GIS-system. To maintain consistency, the GIS coordinates, which are retrieved from SDE, are used to define the WTK geometries for the plan, model and (part of the) world view. Shape attribute data from the GIS database are used to correctly generate and/or display 2-1/2 D and 3D geometries.
For the plan view, 2D polygons are created from the 2D shape data. This is a straightforward task for area features. However, since geometries in WTK only use polygons, point and line features have to be converted. Therefore points are represented by small triangles and lines are buffered. In the model view, these 2D polygons are extruded by one of their attribute values, creating 2-1/2 D geometry. For example, 2D polygons that represent buildings can be extruded by a ‘height’ attribute. In the world view, the 2D polygons created for the plan view, are used to position 3D CAD objects. A ‘height’ attribute is used to define the height of CAD geometry and the CAD model is scaled accordingly (figure 3). The CAD objects are linked to the original GIS shapes using a separate table in SDE. In this table, the CAD model as well as its orientation and scale parameters are stored.
Figure 3. Creation of 2-1/2D geometries from 2D geometries and an attribute value (top), and adjusting a CAD object’s scale to match the generated 2-1/2D model (bottom).
The different geometry representations needed for the views are stored in a single scene graph. We use the level-of-detail (LOD) functionality to store several (simplified) geometries for one object. One can switch between these geometries depending on a specified function, such as the viewing distance.
It is often the case that only a single CAD object is available, which represents multiple shapes in the GIS. Cutting up this object or making independent CAD models for each of the shapes is impractical. Therefore, CAD models can be shared by a number of different shapes. The CAD model is linked to each of these shapes in the database. The model’s center is calculated by averaging the center coordinates stored in the LOD nodes of the shapes.
4. Use of the system
An important feature of the system is the support for manipulation and editing of GIS data from within the VR environment. Several functions have been developed to be able to manipulate, model or analyse the 2D / 2-1/2 D data directly via the different VR interfaces. The actual manipulation, modeling and analysis takes place in the SDE while the setting of manipulation / modeling / analysis parameters takes place in the VR environment. For example, when the user translates and rotates an object in the model view, only the transformation parameters are sent to SDE where the original data is updated. Since we are using a client / server architecture, it is also possible to edit and analyse the data with external GIS applications.
Basic translation and rotation of GIS objects are currently Karma VI’s only manipulation functions. With these functions, it is possible to manipulate individual or groups of GIS objects (see figure 4). Groups of objects are moved and rotated as a single object. Since all objects are defined in 2D (or 2-1/2D) space, rotation is allowed only around the vertical (Z) axis.
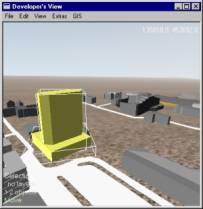
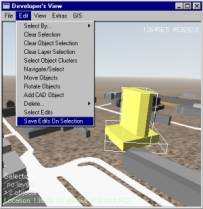
Figure 4. Move and rotate individual, or groups of GIS objects. Left: two GIS objects are selected for manipulation. Right: After translation and rotation, changes are saved in the GIS database
Buffer operations
Performing a 2D spatial query or buffer is a typical GIS operation for which Karma VI provides a front-end. A user selects a single GIS object and sets buffer parameters (see figure 5, left and middle). These parameters are the buffer radius, and the GIS layer (or thematical dataset) in which the spatial query is to be performed. This information is send to the GIS database, which then creates a temporary buffer object and calculates which objects are (completely inside) this buffer object. Within Karma VI, the objects are then highlighted and selected (figure 5 right).
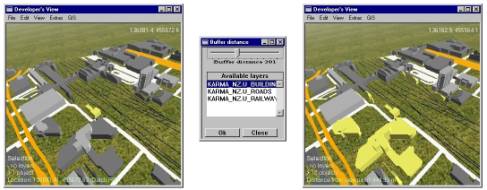
Figure 5. Selection of GIS objects within a user-defined range using a 2D spatial buffer algorithm. Left: A single GIS object is selected. Middle: Buffer parameters are set. Right: All objects within the buffer range are selected.
Triangular Irregular Networks
A Triangular Irregular Networks (TIN) is a 2-1/2D geometry representation, consisting of a (usually large) number of connected triangles. A TIN is often used to model (parts of) the earth’s surface. In Karma VI, TIN’s can be visualised and used to perform visual analysis of an area of interest. For example, a 2D GIS dataset containing tree locations can be positioned on top of a TIN representation of the same area. This way, landscape planners can analyse the visual effect of logging part of a forest (figure 6).
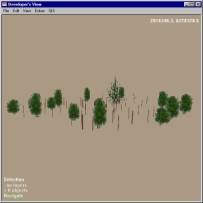
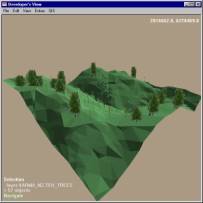
Figure 6. Position a 2D GIS dataset on a TIN surface. Left: A partially symbolic 2D tree dataset. Right: The tree dataset is placed on the 2-1/2D TIN terrain surface.
Measuring distances
Measuring distances is a simple GIS analysis which can easily be integrated in a virtual reality environment, when accuracy is not an issue. With Karma VI, users can interactively `measure’ distances between 2D or 3D GIS objects by pointing and dragging a 3D line (see figure 7). This allows a quick analysis of object-to-object distances, CAD model detail dimensions and object heights.
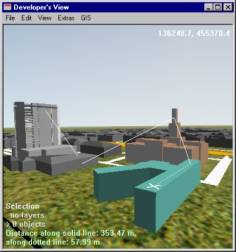
Figure 7. Interactive distance measurement in 3D space.
4. Future developments
The prototype of our 3D-GIS & VR system is operational on PC, Virtual Workbench and the CAVE. Basic geometry manipulation of the GIS data from within a virtual environment like translation and rotation is available. For support of more general geometric manipulations and conversions, we will develop a constraint-based model to support ‘intelligent’ geometric manipulation. Basic GIS functionality like 'identify’, ‘spatial buffering’ and 'query based selection' is available. In the near future, we will further explore 3D GIS functionality like 3D network analysis, 3D buffering and volume calculations. To display the result of the analyses we need a general repertoire of coloring and texturing tools.
For more elaborate analyses and simulations it would be convenient to have a general application interface to the system, that will allow a remote application to retrieve GIS data from the data base, perform a simulation with the data, and then return the results in the form of 3D objects, movements of objects, or as symbolic visualizations. For instance, a program for sound simulation would be able to retrieve the geometry of the terrain and a sound-protecting shield, and would then return a value for each position in the terrain, which could be visualized with pseudo-coloring in the model view, or be heard as audio in the world view.
Since geographic data sets tend to be quite large, problems arise when visualizing GIS data. Next to GIS data, also enormous amounts of CAD data may have to be visualized. Therefore, some optimization is needed to ensure enough graphic performance for real-time display. As already mentioned, the WTK supports the use of Level-Of-Detail techniques: several versions of the same object with varying levels of detail can be stored, but only one of them is displayed at any given time. Whenever a viewer gets closer to the object (and is able to see more detail), a geometry with a higher level of detail is selected. A lower ‘level of detail’ geometry consists of less polygons, and will therefore need less calculation time than a more detailed geometry. A similar technique is Dynamic Object Loading. When detailed GIS or CAD objects are not visible (e.g. behind or very far away from the viewer), they are only taking up memory and valuable processor time. To minimize memory usage, these objects should be loaded into memory only when the viewer is close enough to see them. Another technique is ‘horizon mapping’ which technique uses ‘horizon maps’ (based on impostorsSch95), that capture the horizon part of one frame, and re-uses this part in consecutive frames.
Next to optimizing graphic performance, we will also further develop the user interface. The interface should be easy-to-use and intuitive, and yet efficient. While this is already a big problem on desktop systems, on true VR systems like the Virtual Workbench or the CAVE, it is even more difficult. For example, in a CAVE, the use of a keyboard for text input is not possible. We may have to introduce speech recognition to enable spoken commands, and develop a way to let users specify queries in a combined graphics and spoken-language dialogue. Furthermore, displaying alphanumeric results of a query in a 3D environment will be a problem, especially when a lot of information is returned. This information must be presented to the user in such a way, that the user does not loose his/her sense of immersion. This means that the information must only fill a small part of the user’s field of view, or that the information is integrated into the 3D world (e.g. projected onto the walls of a virtual building). Apart from textual or spoken language in- and output, visual tools (3D widgets) will have to be developed to let users access the GIS and modeling functionality (e.g. 3D analyses, manipulation) of the system.
Next to providing a technically-oriented interface to the system for use by the plan developer, it would also be useful to have an interface that would support policy and decision making. If different plan scenario's could be displayed and evaluated, the system could be a valuable tool in interactive problem-solving situations.