Computer Graphics and Visualization
We work on many topics in rendering, visualization of (scientific) information and modelling of 3D objects. Our goal is to develop new algorithms to generate, represent, interpret, display and interact with data. In particular, complex and large data sets are in our focus, as they play an increasingly important role in many scientific, medical and engineering applications.
Our research currently concentrates on:
- Game Technology (Procedural Generation, Narrative Worlds, …)
- Geometry and Animation (Representations, Optimization, Simulation, …)
- Image processing (Computational photography, Neural Image Generation, …)
- Immersion, Interaction, and Perception (Virtual/Augmented Reality, Vision models, …)
- Rendering (Real-time, Offline, Predictive, Neural, …)
- Visualization (Data, Scientific, BioMedical Visualization, …)
We teach several courses and supervise student projects in these and related areas.
News
27 juli 2023
Martin Skrodzki wins "SIAM GD Early Career Prize"

Martin Skrodzki wins "SIAM GD Early Career Prize"
27 oktober 2021
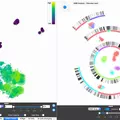
Mapping the brain motor cortex region in detail
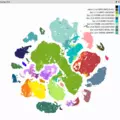
In a major undertaking, an international consortium of researchers successfully mapped the different types of brain cells in the motor cortex. Thomas Höllt and collaborators from Leiden University Medical Center contributed to the development of Cytosplore Viewer, the visualization software that was used to establish the relationship between gene expression and compare them for over 300,000 cells from human, marmoset, and mouse.
21 mei 2019
Afdeling Intelligent systems wint twee keer Eurographics Medische Prijs 2019
14 maart 2019
Elmar Eisemann awarded the 2019 Netherlands Prize for ICT Research

Hij ontvangt de prijs voor zijn onderzoek naar een correcte en scherpe weergave van visualisaties door gebruik te maken van moderne grafische hardware.
12 maart 2018
Eurographics 2018

The 39th Eurographics conference will be held on April 16-20, 2018 in Delft, The Netherlands. Delft University of Technology will host the conference.